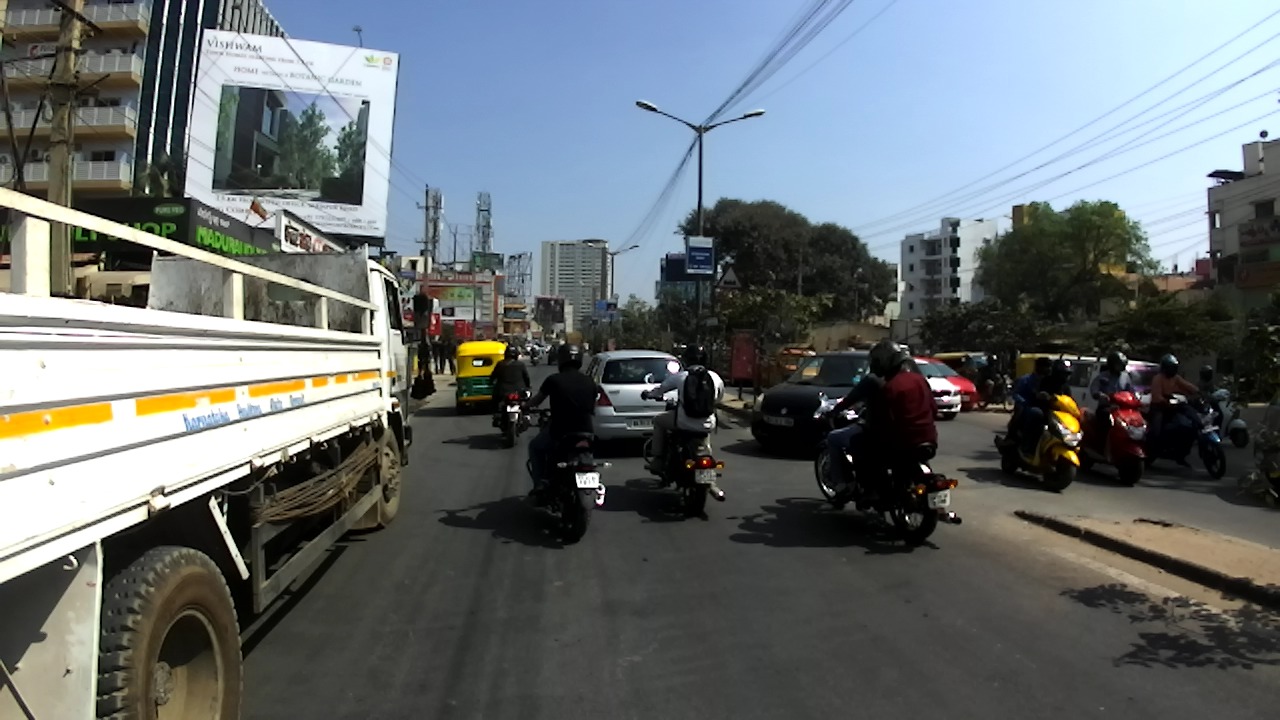
The dataset consists of images obtained from a front facing camera attached to a car. The car was driven around Hyderabad, Bangalore cities and their outskirts. The images are mostly of 1080p resolution, but there is also some images with 720p and other resolutions. The dataset is divided into train, val and test splits as follows:
| Type | Images | Drive Sequences |
|---|---|---|
| Full | 10,003 | 182 |
| Train | 6,993 | 120 |
| Val | 981 | 22 |
| Test | 2,029 | 40 |
Our dataset annotations have unique labels like billboard, auto-rickshaw, animal etc. We also focus on identifying probable safe driving areas beside the road.
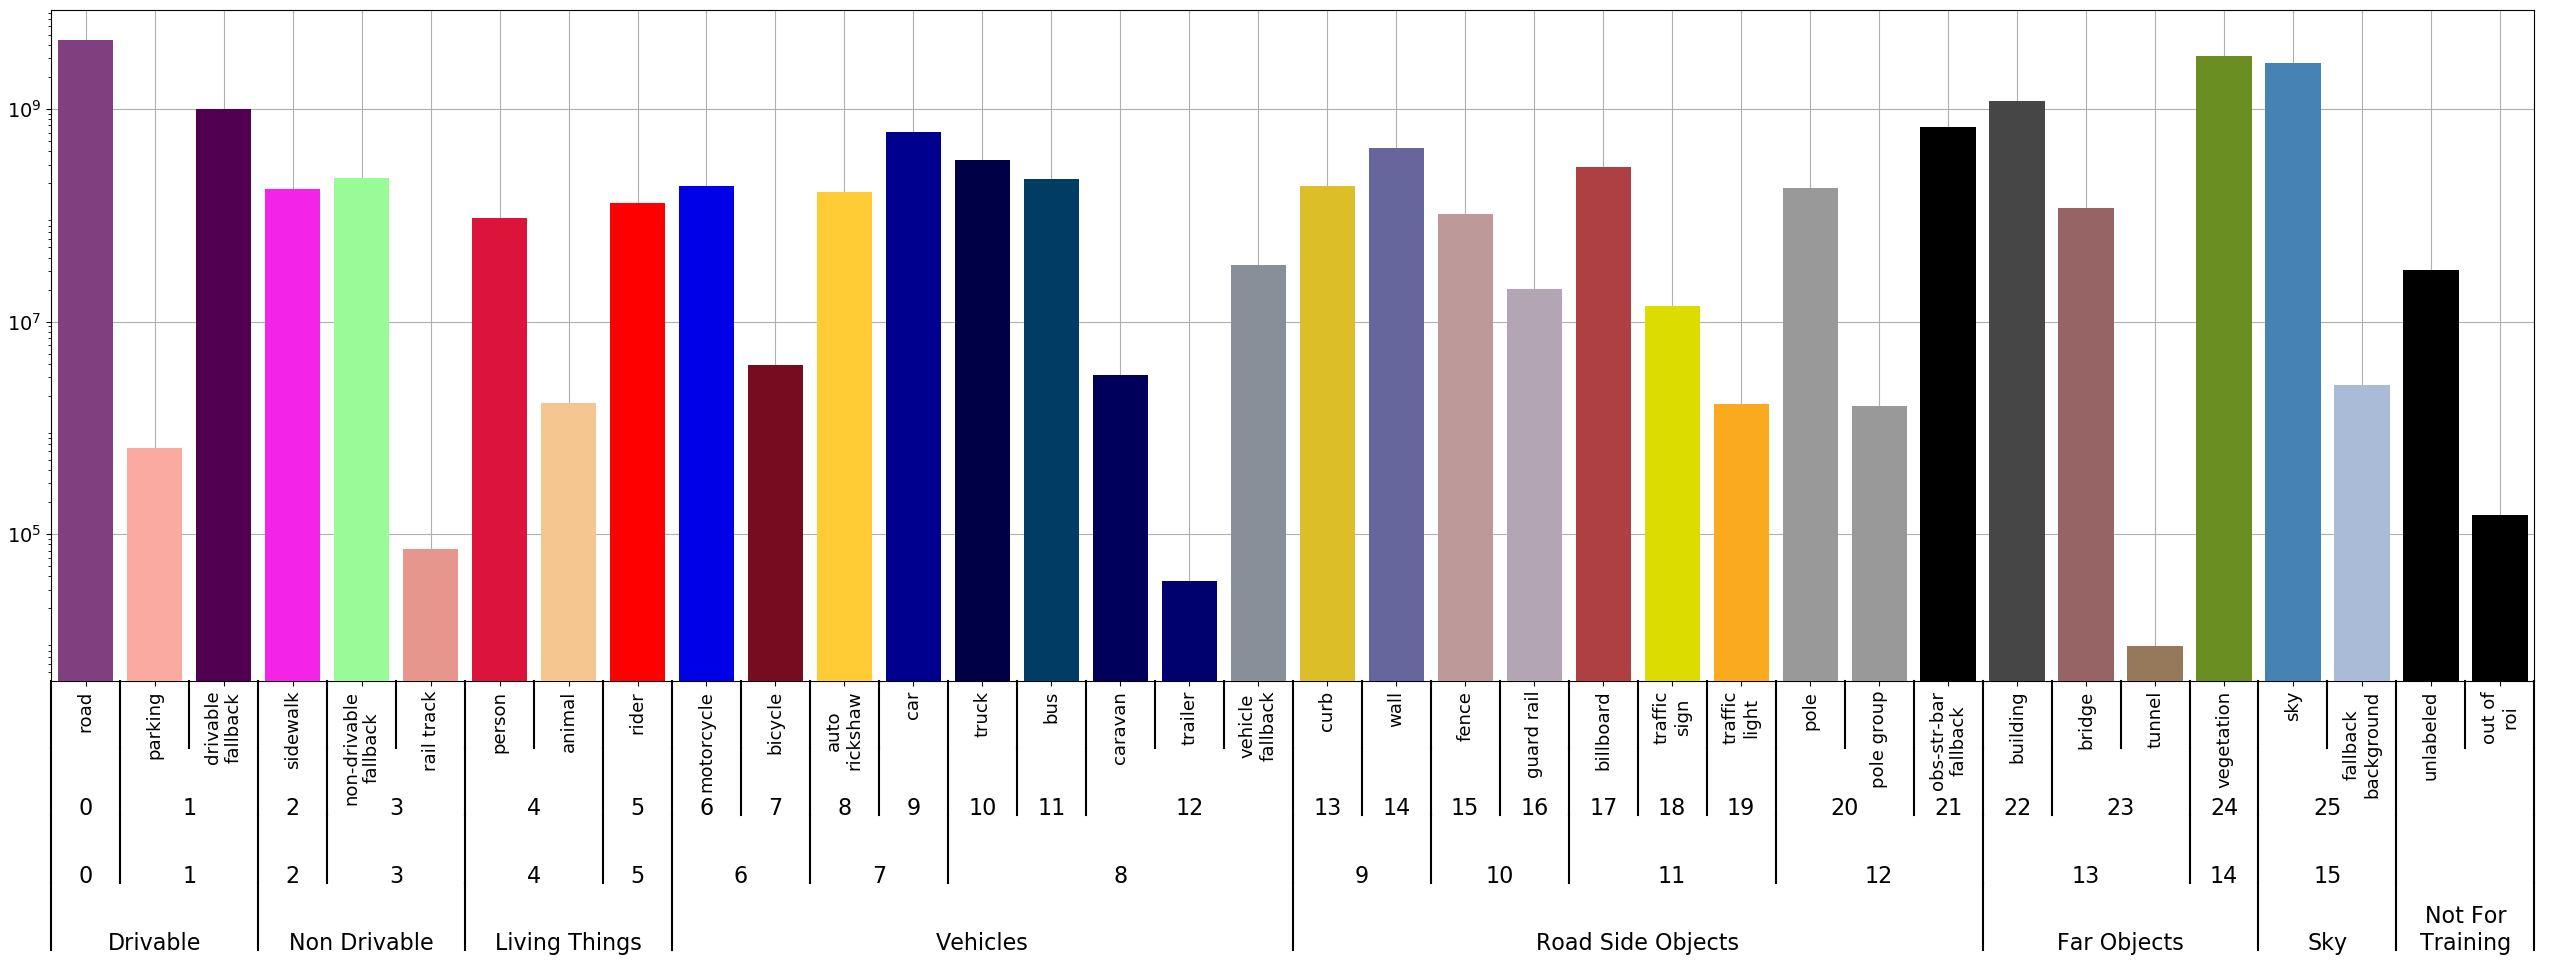
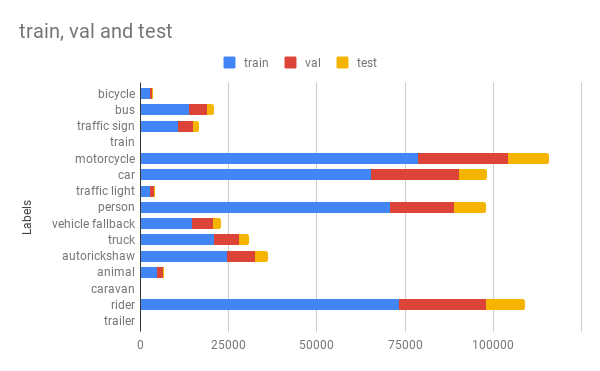
The labels for the dataset are organized as a 4 level hierarchy. Unique integer identifiers are given for each of these levels. The histogram bellow gives:
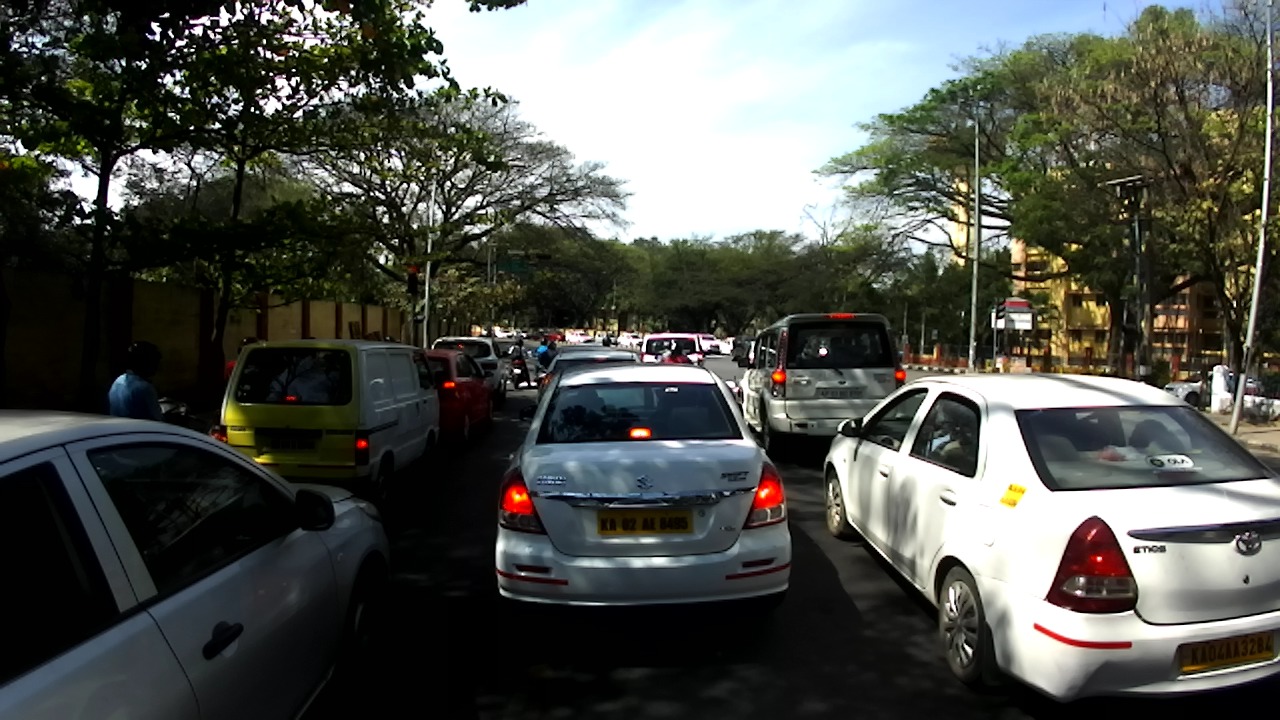
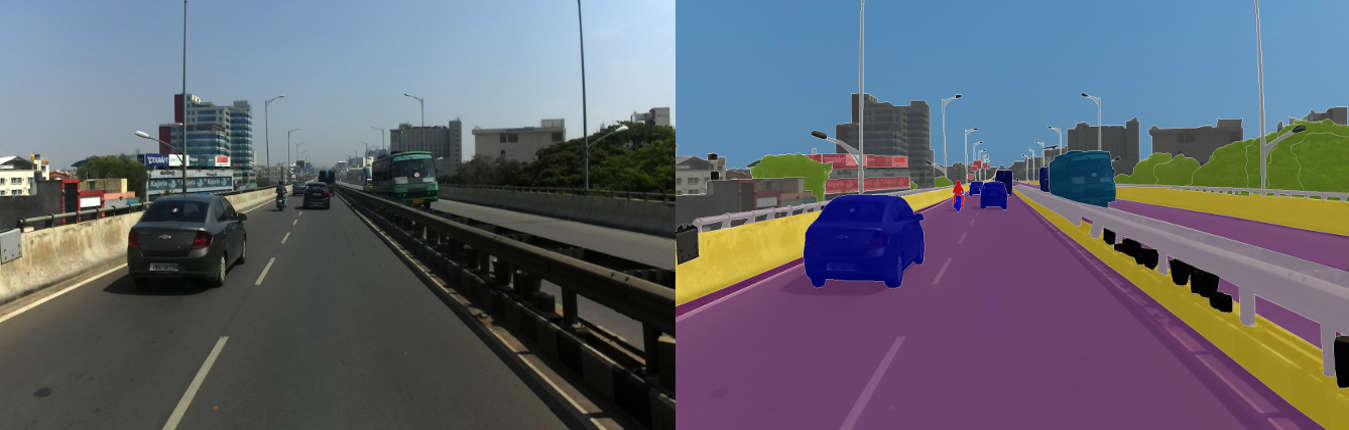
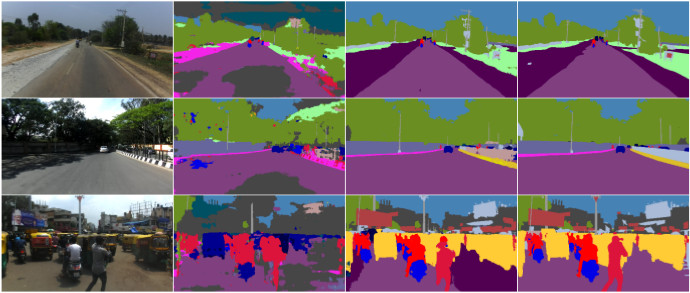
Some examples of the input images, predictions of a baseline Cityscapes pretrained model, predictions of the same baseline trained on this dataset and the ground truths from the validation set (in order of columns) can be seen bellow.
As can be seen models trained on our dataset clearly distinguishes muddy drivable areas beside the road from the road itself. Our dataset has labels like billboards and curb/median's in the middle of the road. Also our image frames are from unstructured driving settings, where road is muddy, lane disciple is not followed often and there is a large number of vehicles on the road.
More information about the dataset and the evaluation code is available here.
The dataset consists of images obtained from a front facing camera attached to a car. The car was driven around Hyderabad, Bangalore cities and their outskirts. The images are mostly of 1080p resolution, but there is also some images with 720p and other resolutions. The dataset is divided into train, val and test splits as follows:
| Type | Images |
|---|---|
| Full | 46,588 |
| Train | 31,569 |
| Val | 10,225 |
| Test | 4,794 |
Below is the histogram of pixel distribution.
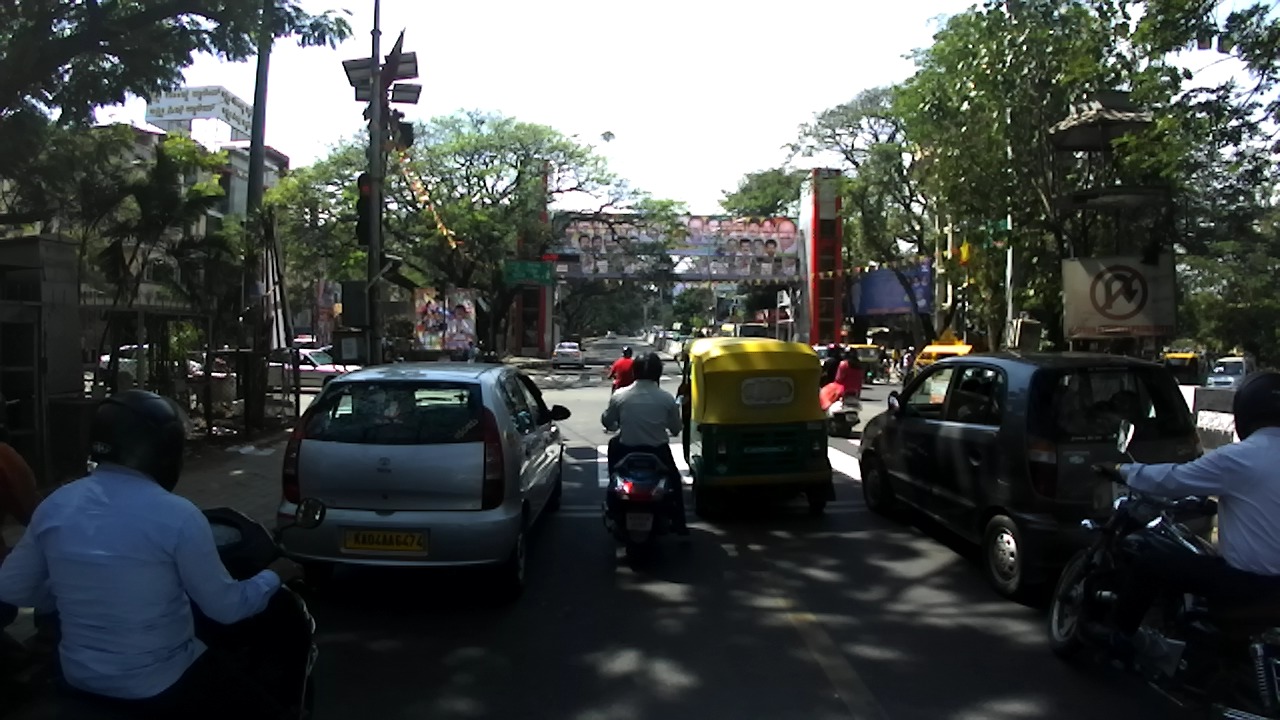
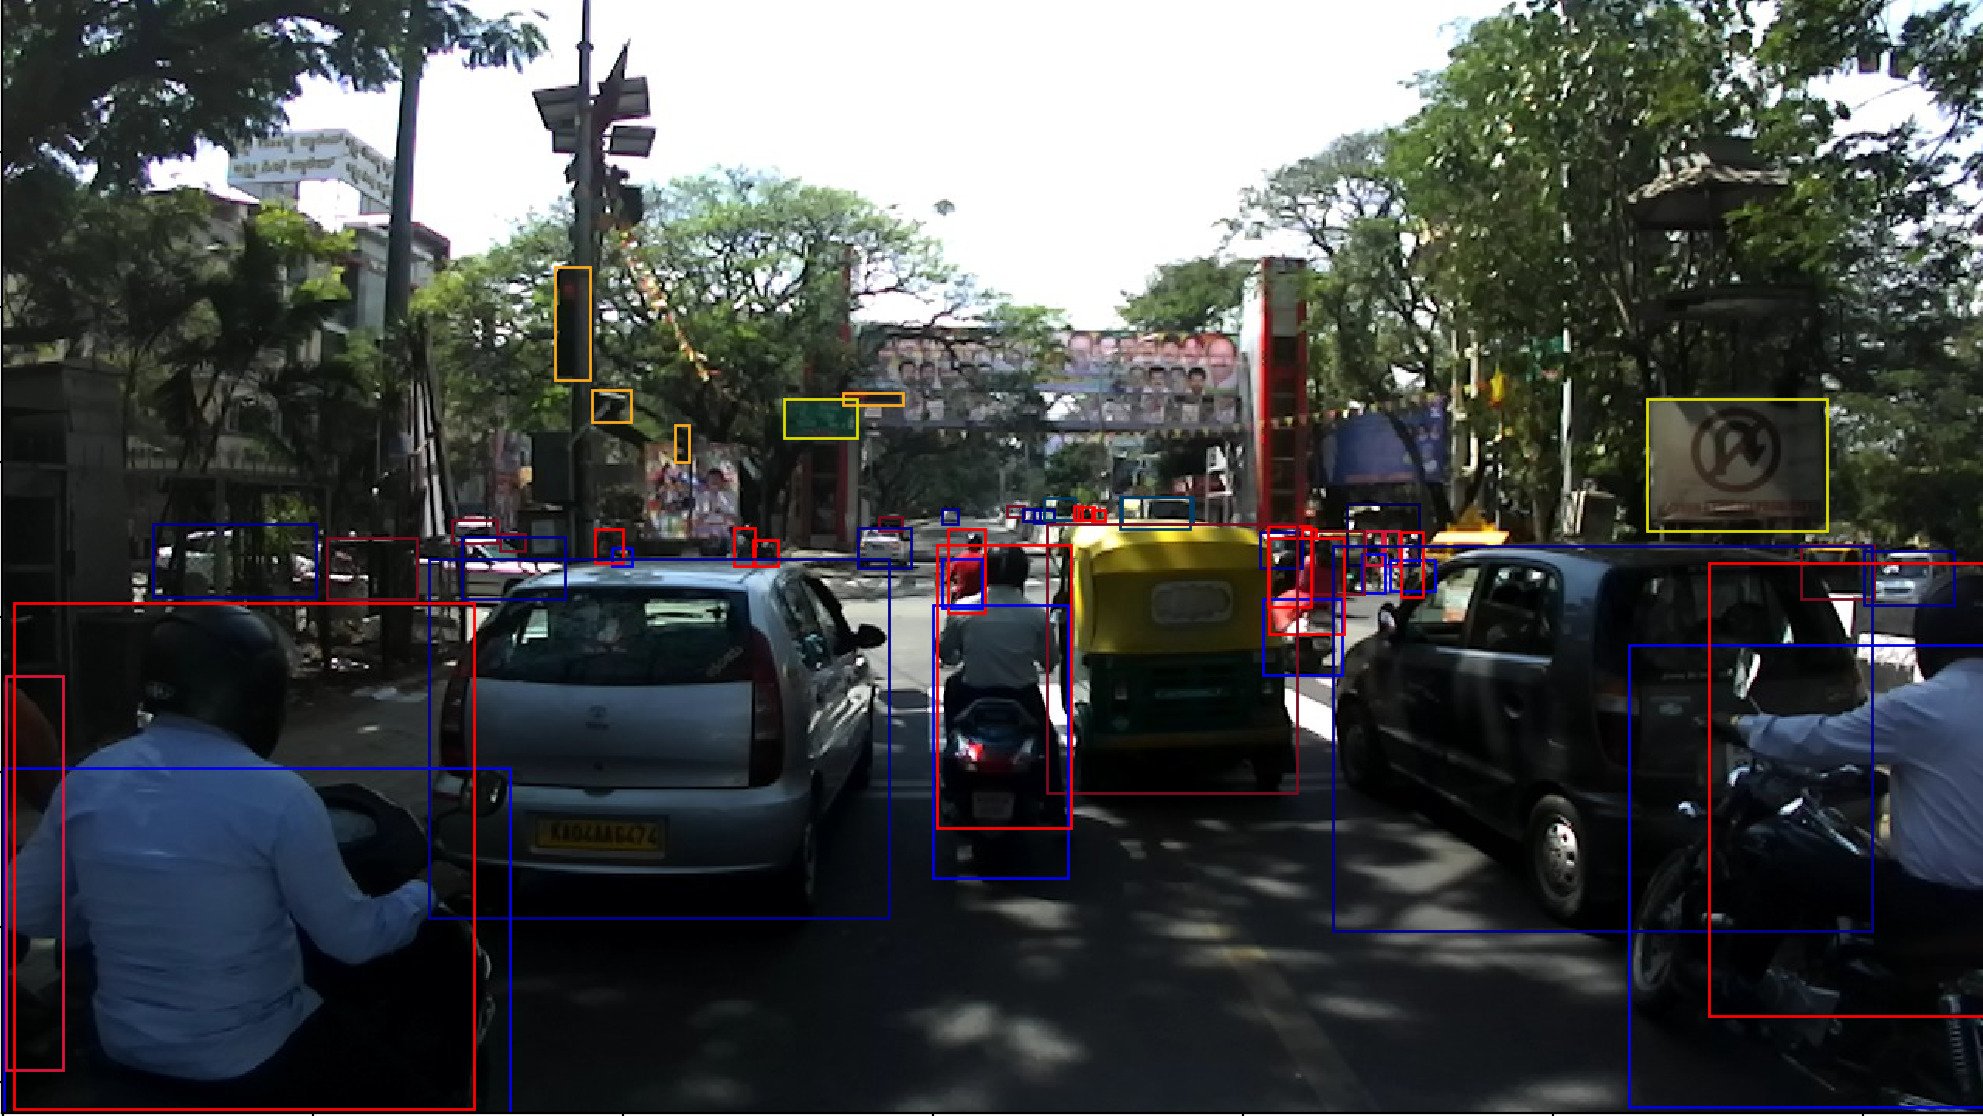
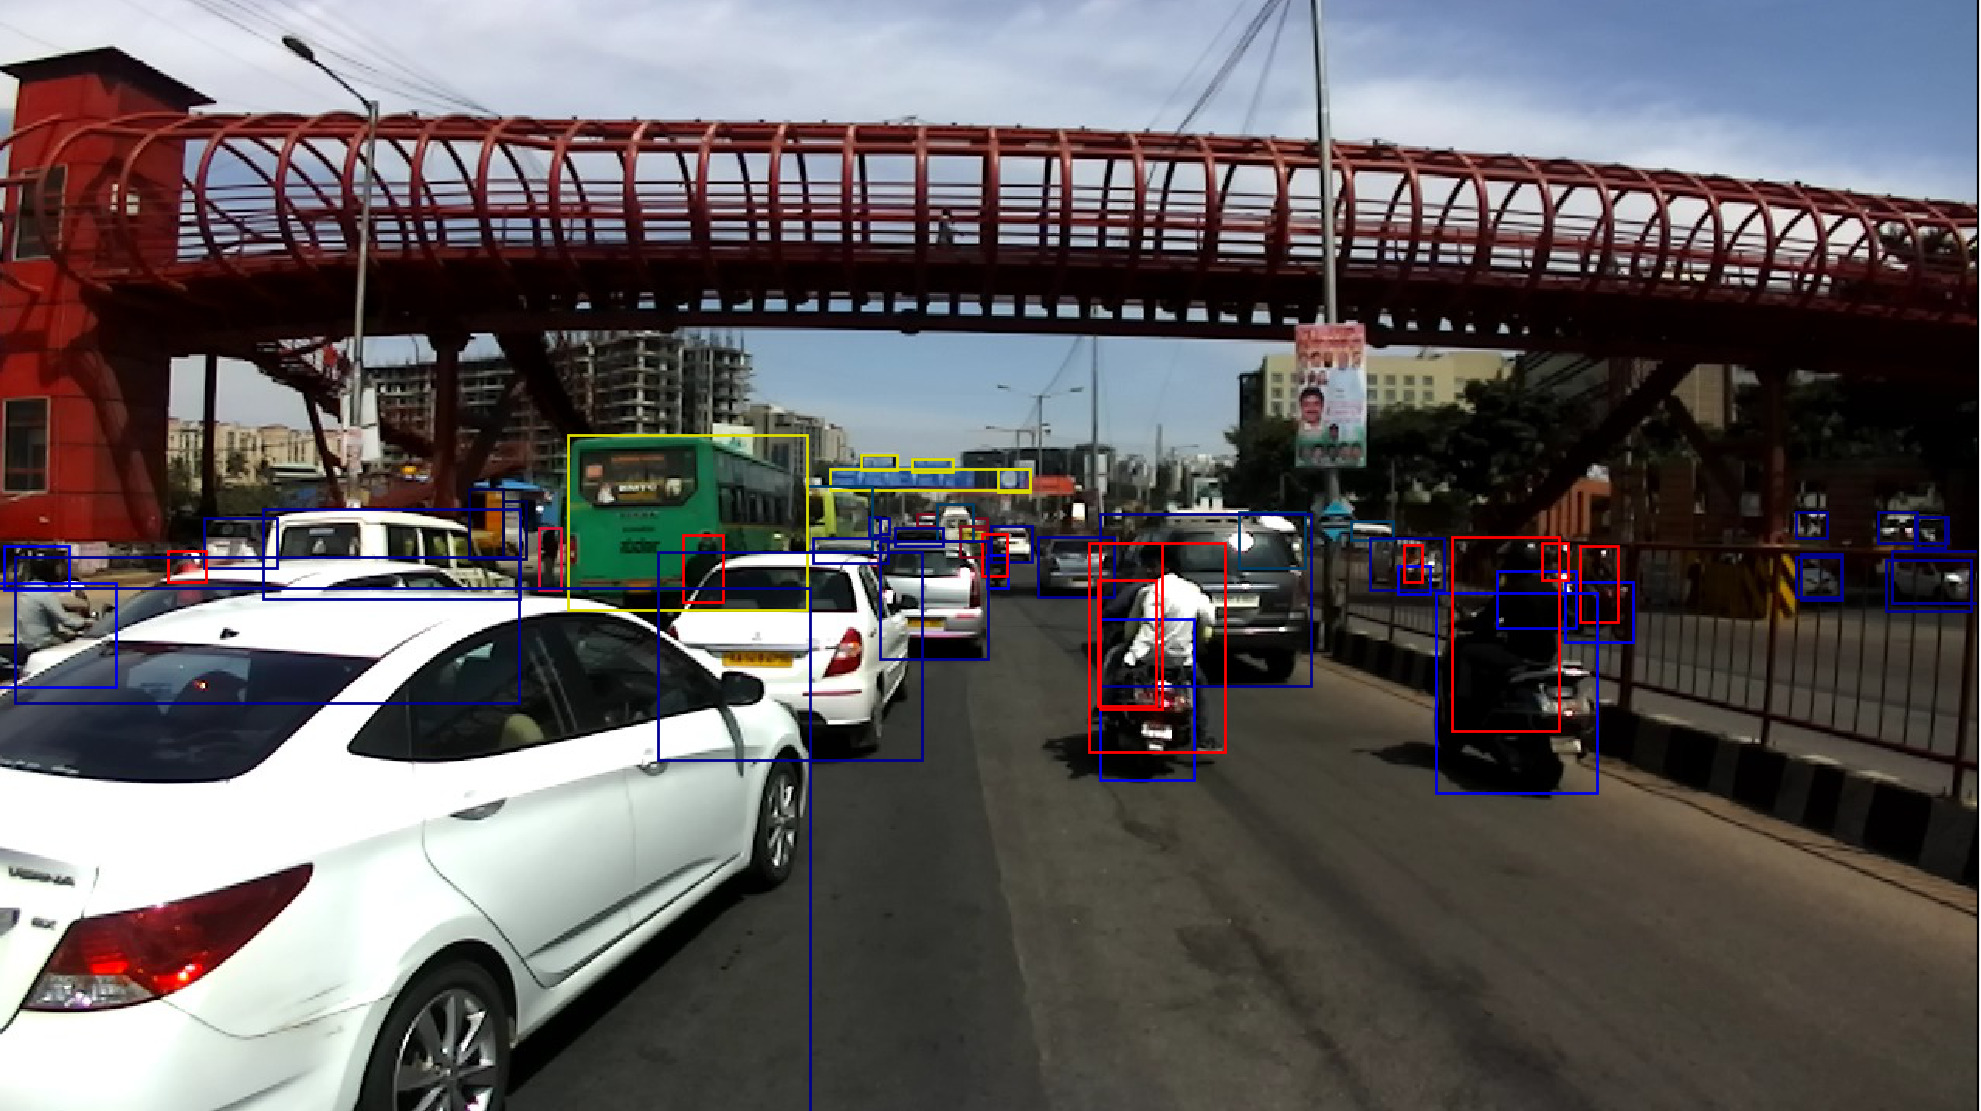
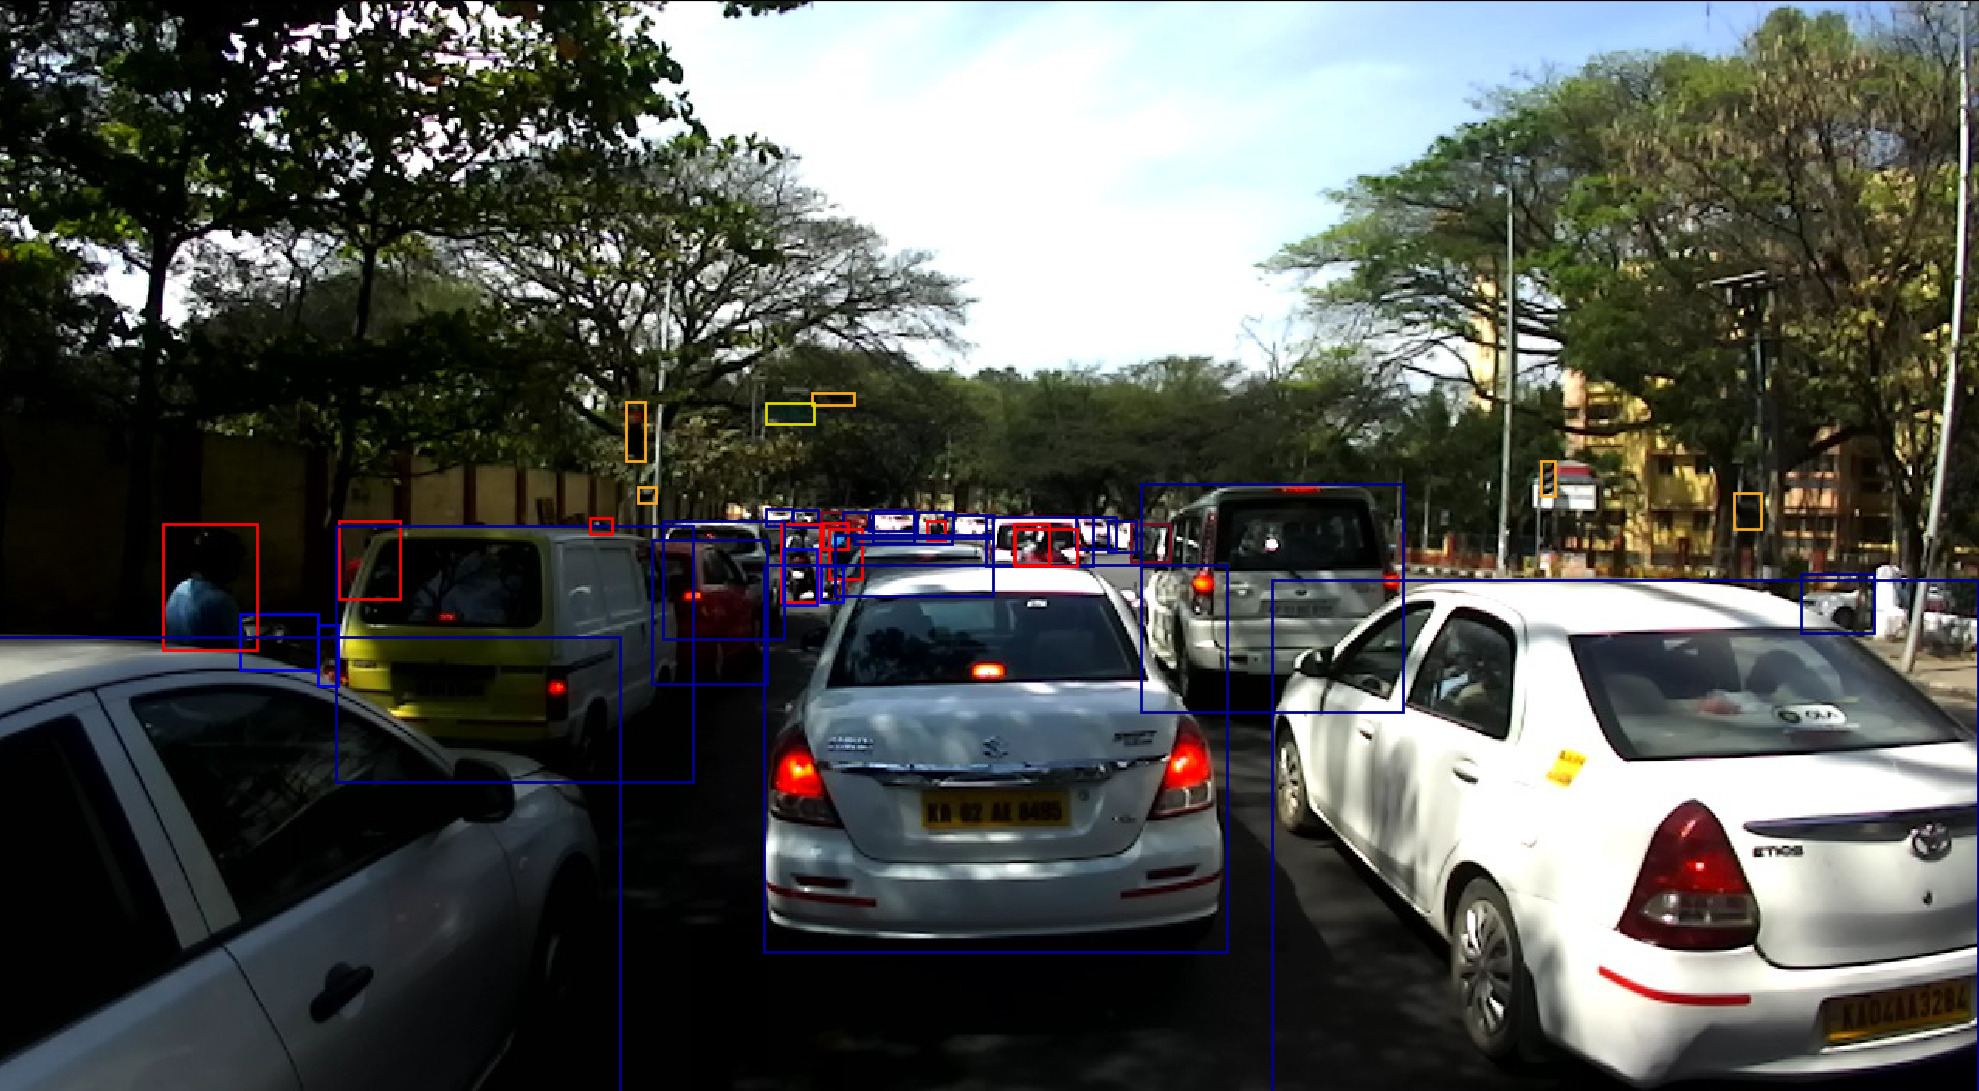
Some images (left) followed by their detection output (right).